See the SlipBefore It Hits
One service across three layers — Power BI reporting, machine learning, and MLOps. Production ML systems that forecast schedule slips, predict cost overruns, and surface safety leading indicators, all running on your real project data. And it isn't just predictive: we also deliver governed Power BI reporting and dashboards on a single source of truth, so leadership sees the same trusted numbers every morning.
What We Deliver
Seven Analytics Practice Areas
From governed Power BI reporting to schedule risk to crew productivity — reporting and production ML across the metrics that move your project margin.
Power BI Reporting & Dashboards
Governed, refresh-on-schedule reporting your leadership actually trusts — built on a single source of truth. Safety, labor, cost, and progress dashboards that replace the spreadsheet sprawl, with row-level security and a clean semantic model underneath.
Schedule Risk & Slip Prediction
Models that read your P6 schedule, productivity data, and historical project performance — and flag which activities are most likely to slip, by how much, and why. Risk-weighted CPM analysis your scheduler can't do alone.
Cost Overrun Forecasting
Predict cost overruns by WBS, cost code, or subcontractor — weeks before they hit your monthly cost report. Built on your actual cost-loaded schedules, change orders, and commitment data.
Safety Leading Indicators
Move from lagging metrics (TRIR, LTIR) to leading ones. ML on inspection data, near-miss reports, toolbox talks, and behavioral observations — surfacing risk patterns before incidents happen.
Real-Time Field Analytics
Decisions that need to happen on shift can't wait for tomorrow's report. Streaming pipelines that process daily reports, equipment telemetry, and field sensor data — surfacing productivity and safety signals live.
MLOps & Model Monitoring
A model that was accurate at project kickoff won't stay that way once site conditions change. We build MLOps infrastructure that monitors drift, retrains on schedule, and alerts before quality degrades.
Crew, Equipment & Sub Analytics
Which crews are actually most productive? Which equipment is bleeding hours? Which subs hit their schedule and which don't? Behavioral analytics on the people and assets that drive your margin.
Power BI Gallery
Real construction reports we've built — safety, workforce, and labor analytics leadership checks every day.
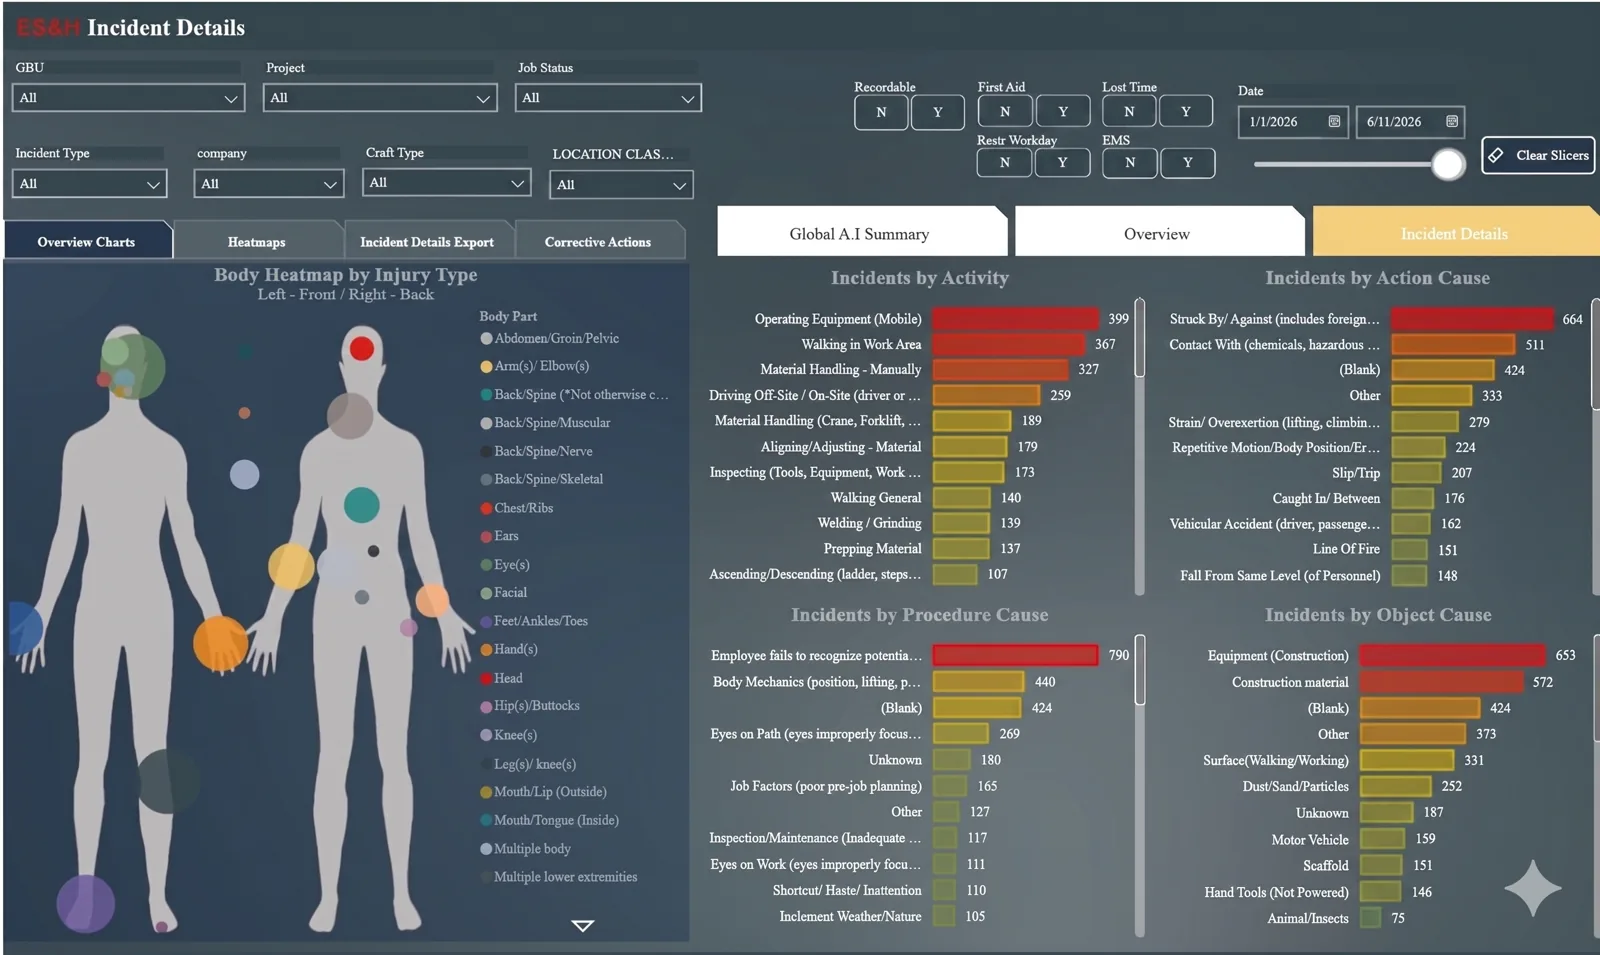
Safety & Incident Analytics
Body-part heatmaps, leading indicators, and root-cause breakdowns by activity, procedure, and object — with an AI summary tab that explains the trend in plain English.
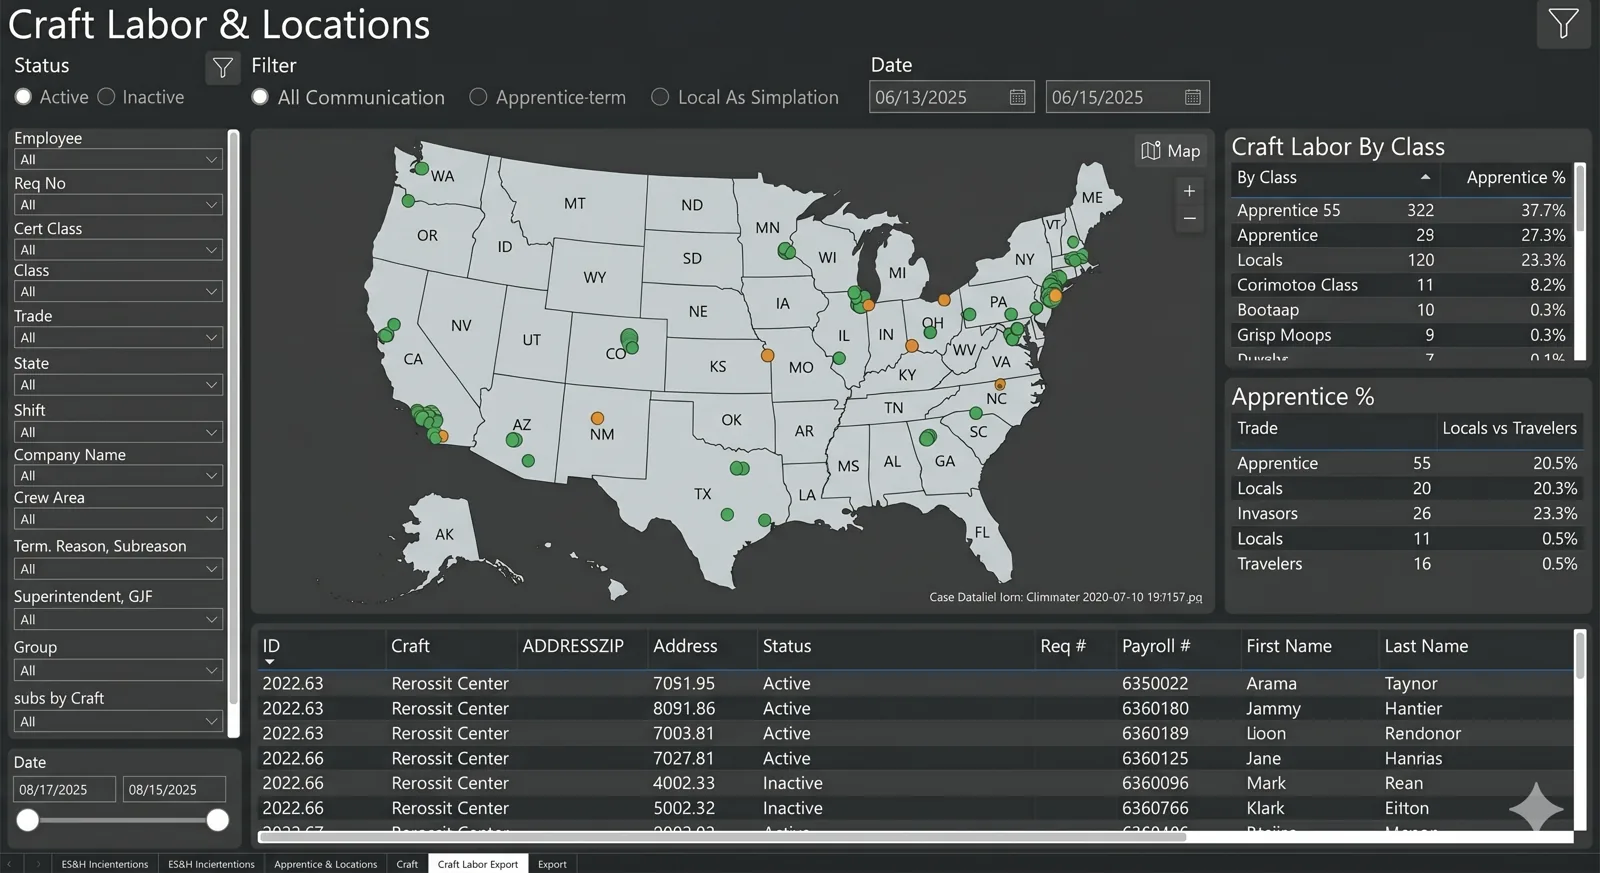
Craft Labor & Locations
Where your workforce is, by craft and class — apprentice ratios, travelers vs. locals, and project staffing on a live national map.
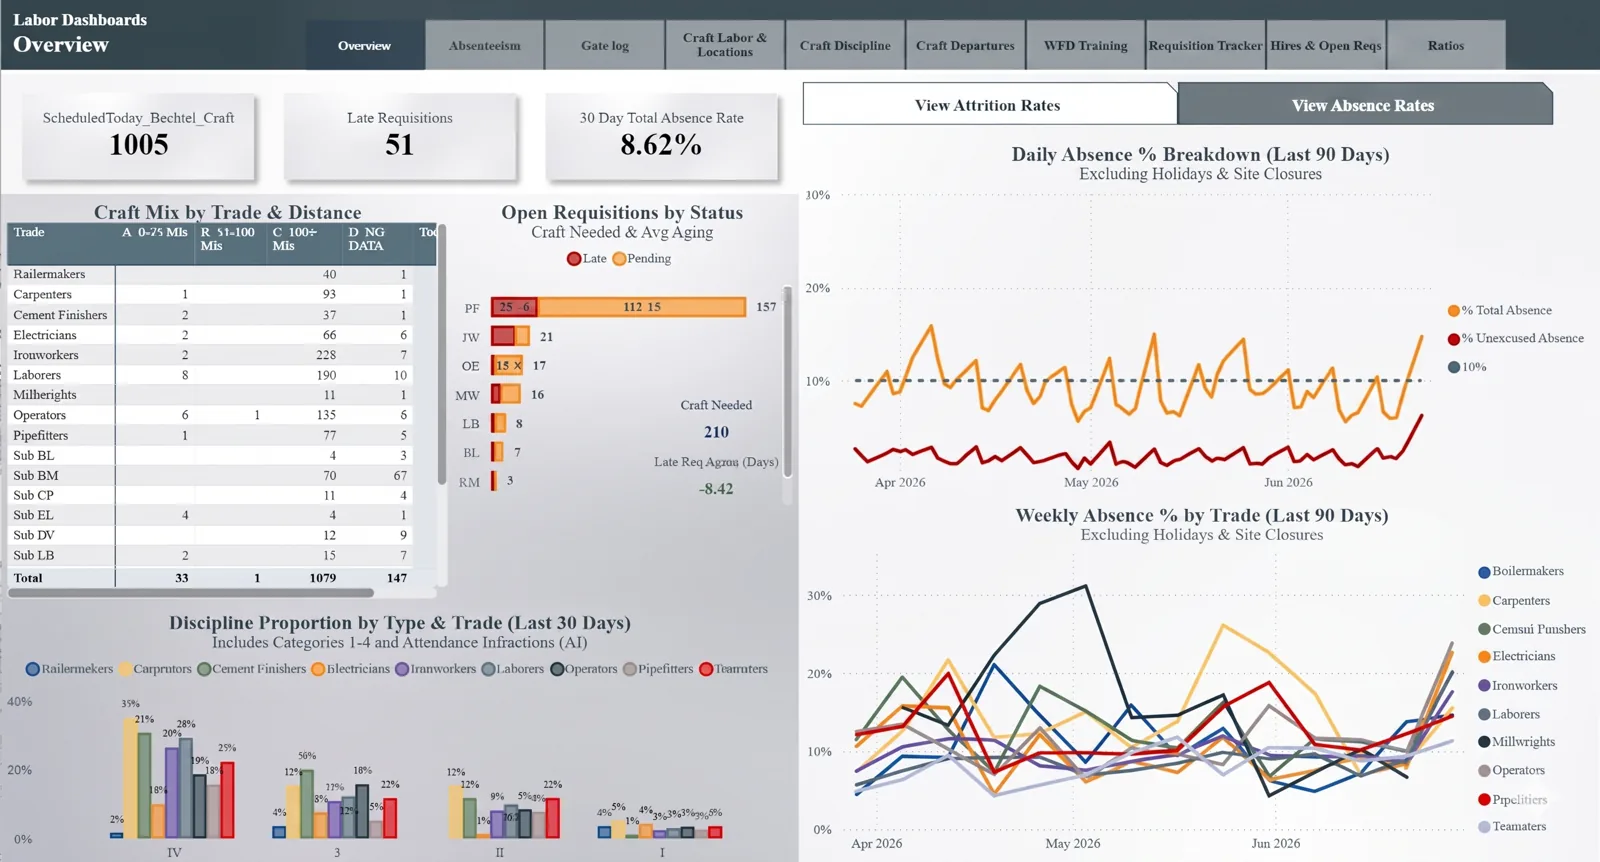
Labor & Attrition Dashboards
Craft mix, open requisitions, absence and attrition trends by trade — the operational pulse leadership checks every morning.
Our ML Development Lifecycle
Rigorous. Reproducible. Production-ready. We don't hand you a notebook — we hand you a system.
Problem Framing
Define the construction question precisely. What's the decision the prediction will change? Whose hands will it land in — the scheduler, the PM, the superintendent? Most ML projects fail here. We don't skip it.
Data Preparation
Feature engineering on your real project data — P6, cost reports, daily logs, safety records. We handle the messy real-world cases: missing data, coding inconsistencies, project-to-project variation.
Model Development
Experiment-driven approach with full tracking. We test multiple algorithms, tune hyperparameters, and validate against your historical projects — with explainability built in from day one.
Production Deployment
Model serving in your environment — embedded in Power BI, surfaced through a P6 plugin, or available via API. Monitoring, logging, and alerting from day one.
How It Plays By Sector
Project intelligence looks different on a petrochemical EPC versus a public-works infrastructure job. Here's how we tailor by sector.
Heavy Industrial / EPC
Infrastructure & Civil
Large Commercial GCs
Owners & Developers
Analytics & ML Technology Stack
Production-grade tools — not academic experiments.
What Would Better Predictions Change on Your Next Project?
Start with a free analytics assessment. We'll identify where governed reporting and predictive models can have the highest business impact on your specific operations and project mix.
Need Power Apps & workflow automation? See Microsoft Power Platform
Back to All ServicesProject Intelligence — Frequently Asked Questions
The answers below are the same text Google sees in our FAQ schema.